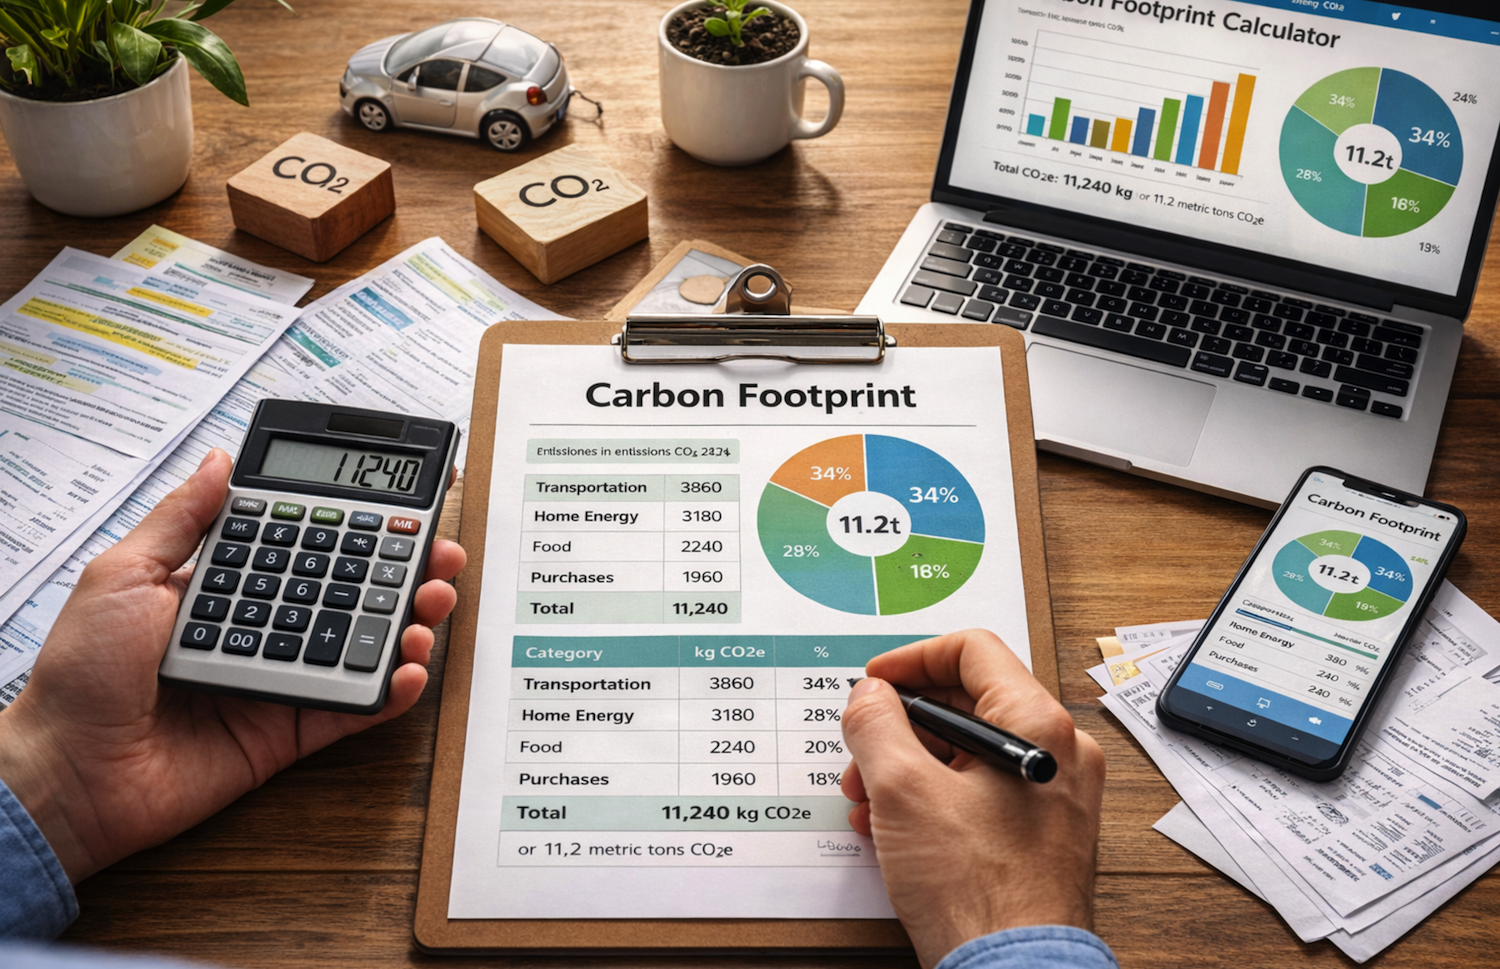
Measuring your greenhouse gas impact can feel technical, but a careful, methodical approach yields usable results that guide real change. This piece explains the concepts you need, shows how to collect the right data, points to trusted emission factor sources, and highlights common errors to avoid. The goal is a defensible estimate expressed in carbon dioxide equivalent per year that helps you prioritize actions and track progress.
Why accuracy matters
Rough guesses can be motivating, but they are also misleading. An accurate personal carbon estimate reveals which parts of your life contribute most to emissions and prevents misplaced effort. For example, small behavioral tweaks may look impressive in a vague calculation but deliver negligible climate benefit when measured properly. Conversely, a well-grounded inventory highlights high-impact opportunities to change transportation habits, energy use, diet, or purchases.
Core concepts to understand before you start
Carbon footprinting expresses the warming impact of greenhouse gases in a single unit called carbon dioxide equivalent, or CO2e. Different gases have different warming effects and lifetimes, so they are converted using global warming potential values over a chosen time horizon, commonly 100 years, known as GWP100. You will also need to decide boundaries: which activities to include and whether you measure an annual footprint or a specific period.
Step 1: Define boundaries and timeframe
Begin by deciding what you will count. At minimum, include direct emissions you control, such as fuel burned in personal vehicles and home heating. Add indirect emissions from purchased electricity. If you want a fuller picture, include emissions embedded in goods and services you buy, food, air travel, and digital services. Defining a one-year timeframe makes most sense for comparing year-to-year changes and aligning with common emission factors.
Step 2: Gather activity data
Good input data is the cornerstone of accuracy. For household energy, use bills showing kilowatt-hours or therms rather than estimations. For driving, log fuel added or use the vehicle’s odometer and fuel economy information. For flights, collect itineraries with distances or use airline-provided distance data. For purchases and services, keep receipts or use annual credit card or bank statements to estimate spending-based emissions when product-level data is not available. Eating and waste can be estimated from typical consumption patterns recorded over a representative week and scaled to a year.
Step 3: Select reliable emission factors
Emission factors convert activity data into emissions. Choose reputable, transparent sources. National agencies maintain public factor sets: for example, the UK emissions factors prepared by the government, the US Environmental Protection Agency’s factors, and internationally recognized guidance from the Intergovernmental Panel on Climate Change and the International Energy Agency for electricity intensity. Use electricity factors that match the geography and timeframe of your consumption; grid carbon intensity varies by region and by hour, and average annual values are different from marginal or hourly values. For aviation and shipping, look for distance- or flight-specific factors from aviation authorities or established calculators that disclose methodology.
Step 4: Perform the calculations and express results in CO2e
Multiply each activity quantity by the corresponding emission factor and sum the results to get total emissions in mass of CO2e for the chosen period. For mixed greenhouse gases, ensure conversion to CO2e uses the same GWP basis across all factors so that pieces add up correctly. Many spreadsheet templates and open-source calculators will handle these multiplications for you, but check that the calculators cite their emission factor sources and the GWP version they use.
Step 5: Handle uncertainty and check your work
No personal inventory is perfectly precise. Uncertainty comes from variable activity patterns, imperfect data, and emission factor variability. To manage this, record the data sources and assumptions you used, and where possible run a sensitivity check by recalculating using higher and lower plausible values. For items with large uncertainty but potential high impactsuch as annual air travelavoid ignoring them. Instead, document a reasonable range and consider using midpoint values while noting the spread of possible outcomes. If you want greater confidence, compare your results to reputable online calculators as a sanity check, making sure you understand differences in scope.
Practical tools and trusted data sources
There are established calculators and datasets that help translate activity into emissions while explaining methodology. Government or research institution factor tables are usually well documented and updated periodically. Some organizations publish life cycle or sector-specific factors for products and food items. When using a third-party calculator, prefer those that display the emission factors used and explain how they treat tricky items like radiative forcing for aviation or embodied emissions in manufactured goods. Open-source tools allow you to inspect and modify assumptions, which is valuable if you want an audit trail for your personal inventory.
Common mistakes and how to avoid them
One frequent error is double-counting. If you include emissions from electricity consumption and also include a purchase category that already embeds that electricity use, you inflate your total. Another trap is mixing regional emission factors without adjusting for where the activity physically occurred. Using outdated or non-transparent factors will undermine your estimate, so always check publication dates and methodology notes. Avoid overconfidence in precise-looking numbers; remember that reporting three significant figures does not mean three-digit accuracy when activity data or factors are approximate.
Turning measurement into meaningful action
Once you have a defensible estimate, use it to prioritize. Identify the largest contributors and investigate the most effective ways to reduce them. For household energy, switching to lower-carbon electricity or improving insulation typically offers lasting reductions. For travel, reducing flight frequency or choosing lower-emission transport modes tends to have a larger effect than marginal changes in behavior. For purchased goods, extending product lifetimes and choosing lower-impact materials often reduces embedded emissions. Track changes year over year using the same methodology so comparisons reflect real change rather than shifting assumptions.
Finally, keep records. Store the original bills, logs, and source links for emission factors and calculators so you can update your inventory in future years or justify decisions about offsets or claims you might make. The value of a personal carbon inventory comes from its ability to steer practical choices, not from looking precise on first calculation. With a disciplined approach to boundaries, data, and transparency, your footprint becomes a useful tool for reducing emissions and aligning daily life with long-term climate goals.