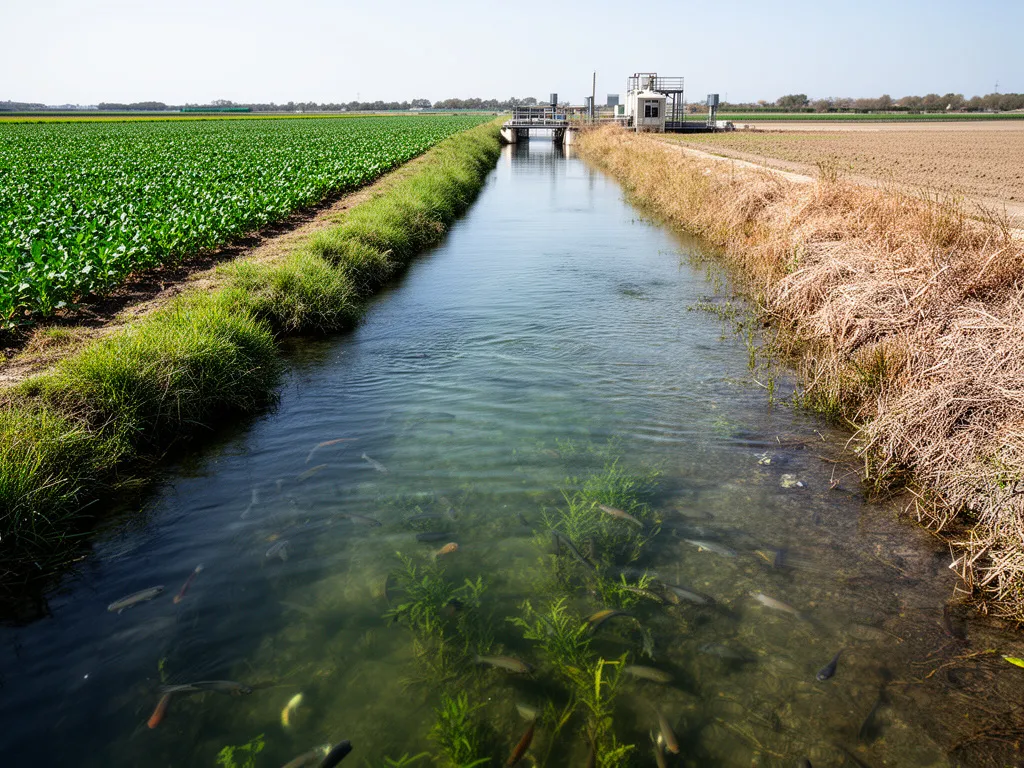
What a water footprint measures
The term water footprint describes the volume of freshwater used directly and indirectly to produce goods, services or to support an activity. It captures three related dimensions. One dimension covers the water consumed from surface and groundwater sources for irrigation, industrial cooling and other uses. A second covers rainwater consumed by plants. A third captures the water required to dilute pollutants so that water quality remains within acceptable limits.
Blue, green and grey water explained
Blue water refers to water sourced from rivers, lakes and aquifers that is withdrawn for irrigation, industry and domestic use. Green water is the soil moisture from rainfall that is used by crops and natural vegetation. Grey water is a metric for the freshwater volume needed to assimilate pollutants produced by an activity to meet a specified water quality standard.
How footprints are calculated for products and organizations
Calculating a water footprint starts with an inventory of water inputs and outputs across a product life cycle or organizational boundary. For products this typically means agricultural production, processing, transport and retail. For organizations it means operational water use and water embedded in purchased goods and services. A life cycle perspective avoids double counting and reveals hidden hotspots that occur upstream in supply chains.
Two common measurement approaches are volumetric accounting and scarcity weighted accounting. Volumetric accounting reports raw volumes of blue, green and grey water. Scarcity weighted methods adjust volumes according to local water stress so that a litre used in a water scarce basin carries more weight than a litre used in a water abundant basin.
Interpreting water footprint numbers
A water footprint number gains meaning when it is compared to context. Useful comparisons include footprints per unit of product, footprints per unit of nutritional value for food, footprints relative to regional water availability, and trends over time. A large blue water footprint in a basin with low renewable supply signals a higher risk than the same footprint in a water abundant basin. Grey water values point to potential pollution pressure even where volumes are small.
How climate interacts with water footprints
Climate influences both the supply and demand sides of freshwater. Changes in precipitation patterns shift the amount and timing of green water available to crops and natural ecosystems. Rising temperatures increase evapotranspiration which raises irrigation demand and can reduce river flows. Changing snowfall and glacier melt alter seasonal water availability for river basins that depend on mountain runoff.
These climate driven shifts change where and when water footprints create risk. An operation that relied on stable river flows for cooling or irrigation can face interruption when flows decline. Agricultural products grown in regions becoming drier may require more blue water to sustain yields, increasing the blue water footprint and amplifying competition with ecosystems and other users.
Feedbacks between water use and climate
Water management choices can also affect local and regional climate. Irrigation changes land surface evaporation which can alter humidity and local temperature. Wetland drainage or conversion of natural vegetation to cropland modifies land cover and can change heat and moisture fluxes. These interactions happen at local to regional scales and can influence rainfall patterns in some cases.
Connections between water footprint and freshwater ecosystems
Freshwater ecosystems depend on flow regimes, water quality and connectivity. Water withdrawals reduce flows, change timing and fragment habitats. Pollution alters oxygen levels, nutrient balances and toxicant concentrations. Even small changes in flow or chemistry can disturb species that rely on seasonal cues for migration, spawning or feeding.
A high blue water footprint in a river basin often correlates with stress on aquatic life if withdrawals exceed environmental flow needs. A high grey water footprint signals potential chemical or nutrient loads that can cause algal blooms, dead zones or loss of biodiversity. Green water usage affects soil moisture and vegetation structure which in turn supports terrestrial species and regulates erosion and sediment delivery to rivers.
Examples of ecosystem impacts to watch for
- Reduced low flows that concentrate pollutants and raise water temperatures
- Altered seasonality of flows that disrupt fish spawning and invertebrate life cycles
- Increased sedimentation from land conversion that smothers spawning grounds
- Eutrophication from nutrient loads that creates oxygen poor zones
Assessing water footprint risk in practice
Risk assessment combines footprint volumes with the basin context. Key elements are the local water balance, existing demand from other users, known pollution issues and ecological flow requirements. Temporal alignment matters. A crop may need large volumes during a dry season when rivers are lowest and ecological vulnerability is highest.
Tools and approaches commonly used in practice include basin water accounting, water stress maps, environmental flow assessments and pollution inventories. Scarcity weighted footprint indicators and exposure metrics help compare risks across locations and suppliers. For companies, mapping the geographic origin of key inputs reveals supply chain hotspots where water stewardship actions will have the greatest effect.
Practical steps to reduce water footprint and protect ecosystems
Many effective measures align resource efficiency with ecosystem protection. Technical, management and sourcing choices can reduce both volumes withdrawn and pollution discharged while often improving resilience to climate variability.
- Measure where water is used and where it comes from. Prioritize basins with high blue water use or known stress.
- Reduce demand through efficiency. Examples are precision irrigation, efficient cooling systems and low flow fixtures in buildings.
- Improve agricultural practices to lower both blue water dependence and pollution. Practices include drip irrigation, adjusted planting dates, cover cropping and improved nutrient management that reduce runoff.
- Reuse and recycle process water where feasible. Closed loop systems reduce withdrawals and lower effluent volume.
- Treat wastewater to reduce grey water pressure. Upgrading nutrient removal lessens eutrophication risk downstream.
- Shift sourcing toward lower impact regions or crops when viable. Sourcing decisions should consider seasonal stress as well as annual averages.
- Support catchment scale measures. Protecting wetlands, restoring riparian vegetation and improving soil health can increase natural storage, reduce flood risk and improve water quality.
How to choose interventions
Prioritize interventions by combining footprint magnitude, local water stress and ecological sensitivity. Actions that reduce blue water in high stress basins and lower grey water where water quality is poor will usually deliver the largest social and ecological benefits. Monitor both water volumes and ecological indicators so that improvements in one area do not create unintended harm elsewhere.
Policy and market instruments that influence water footprints
Regulatory measures such as abstraction permits, effluent standards and environmental flow rules set the baseline for acceptable water use. Market instruments include water pricing, trading schemes and certification programs that incorporate water stewardship criteria. Disclosure frameworks increasingly ask companies to report water risk alongside greenhouse gas emissions so investors and buyers can compare performance across suppliers.
Voluntary standards for agricultural commodities sometimes include water related criteria. Certification alone does not guarantee low impact. Credible approaches combine measurement, on the ground verification and long term basin engagement that aligns private actions with public water management.
Questions organizations should ask when evaluating water footprint claims
When assessing a reported water footprint consider these aspects. Does the method separate blue, green and grey water and explain geographic sourcing. Is scarcity weighting used and if so what stress indicator is applied. Are boundaries clear for products and organizational footprints. Does reporting include temporal detail so seasonal risk is visible. Is there evidence that findings informed specific water stewardship actions with measurable outcomes.
Where to look for further guidance and data
Useful public data sources include national water agencies for river flow and withdrawal statistics, international organizations for methodology guidance and scientific literature for methods linking water use to ecological impacts. Basin level studies and environmental flow assessments are valuable when available because they provide the local context that a volumetric footprint alone cannot capture.
Transparent reporting, combined with targeted basin engagement, gives the best chance of reducing water related risk to people and nature while adapting to a changing climate.